by Stacy Muller.
Before we get started on the HEART of my technical proposal, I just want to make sure that you understand, when I talk about some range or zone being accurate to a stop, what a "stop" is - even though I did briefly explain it earlier, and similarly in my video. I think though that it's worth me saying a little bit more about the stop here. On your camera, you can adjust the the exposure of the scene you are trying to capture, resulting an a difference of brightness in the resulting image, and you can do this adjustment by, for instance, a full stop. A stop then is a doubling or halving of light - in this case, the amount of light you are allowing into your camera. A slightly less traditional stop is one that involves amplifying the signal and noise in the camera's sensor to give the EFFECT of greater exposure - in this case an effective stop added through doubling the ISO.
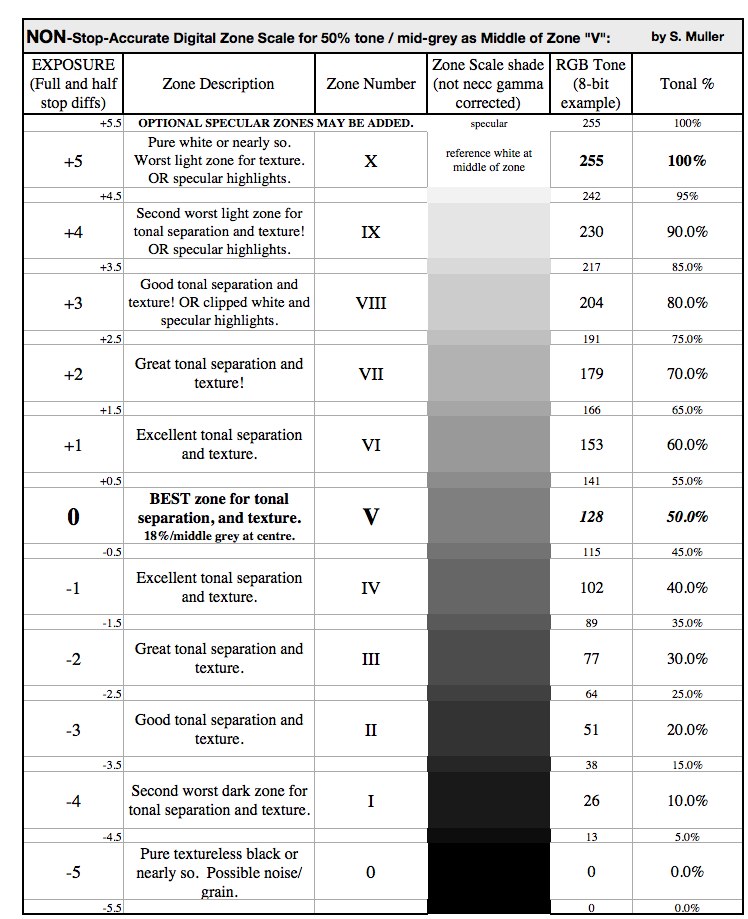
In ANY case, one stop brighter won't APPEAR twice as bright though but quite a bit less, and one stop darker won't appear half as bright or anywhere as much, and that's for reasons I'll get into, but NOT in any great detail in this presentation even though it IS one of my favourite topics in my e-book! For now, it should suffice to say that the increments between stops can visually seem smaller than what a lot of people might expect, and about equal if you only witness a few increments, or, if you are really observant, you might see that in reality the increments are NOT equal. That gets into something important called tonal compression that I'll soon get into as well, but I don't want to get ahead of myself just yet. Cameras typically allow you to adjust exposure by a stop, or a half stop, or even a third stop which, personally, is a difference I often find difficult to impossible to perceive especially where the tonal increments get smaller. Some people would probably prefer that cameras could be adjusted by equal tonal increments instead - say 5% at a time - so we could easily map tones to a scale of zones where most span a 10% range, like in THIS zone scale:
But the reality is, cameras don't work that way, nor SHOULD they. There's a lot of POWER in instead using the traditional full stops, and fractional stops, that will likely become more evident to you if it has not already, and if you stick with me to see what I'm proposing. Traditionally most zone systems include zones where most DO span a stop each. If you disregard the tonal shades and values above then, you have a serviceable and rather traditional zone system - with middle grey at zone V and zone V at the very centre of a practical dynamic range of 9 stops - or 7 if you include only the one-stop exposure zones that are considered to contain texture (via zones II to VIII). Although this is a good rule of thumb to follow that has been around for decades applicable at least to a monochrome film medium if not others, and not bad to follow for at least some digital cameras as well; we could debate whether there is some deviation to this with OTHER film stock and digital cameras, and by how much. Or more importantly, we should look at creating scales of exposure zones customized to those other various mediums!
In that vein, here is the HEART of my technical proposal:
Introducing my new system and zone scales is the MOST important thing I'm trying to do. Secondly I am claiming inaccuracies in other digital zone systems in comparison to mine and trying to prove these. Obviously these other systems have been around for some time and HAVE proven useful for both editing one exposure and editing and blending multiple exposures, but I believe many people will come to prefer the greater convenience of my stop-accurate tonal scale system for this. The authors of digital zone systems are perfectly honest that the majority of their zones are NOT a stop in range each at least in terms of the tones on the the scale they show (nor, for at least one system with tonal divisions similar to the one in the chart above, are the majority of the zones a stop in range in any other way - with one author admitting the distance between zone V and zone IX centre-to-centre being NOT 4 stops that would be convenient for a spot meter, but closer to 2-1/3 if we are abiding by the tones). Such a lack of complete one-stop accuracy can be problematic for capturing and blending together more than one exposure. Even for editing just one exposure, my system better accounts than others for the natural tonal compression and expansion between exposure levels - which is something I explained in the video and will expand on fairly soon here.
Really, though, the most important thing I can say about all that I can do so simply right here:
Stops simply do not differ from each by the same tonal increment.
The MOST important thing I'm trying to do is to introduce a NEW zone system with accuracy that, at the very least TONALLY, is IMPROVED over other digital zone systems and, with that, has improved usefulness. In particular, the usefulness comes in using HDR techniques to acquire an image that may look more true to the scene that YOUR EYES saw compared to what you would have acquired without using those techniques. In other words, we want to capture a scene that has a very high dynamic range of very dark to very light tones, or least a great part of that range that you might see just fine, but that our camera simply can not capture in just one exposure. Because of this limitation, just one exposure would destroy the detail in the darker and/or lighter areas - so we have to take multiple exposures and blend them together to solve such problems. But if we attempt this in a way that is random or imprecise at any point in our workflow, which ranges from image capture to image editing, not to mention the final product; we PROBABLY won't like our results. Whether you want to to correct your exposures to make the final image look more realistic and avoid what many people call an overdone HDR effect, or you LIKE at least SOME HDR-based enhancement of your image, you'll benefit from having precise control either way in creating your vision.
And by the way, speaking of precision, there are reasons that you should acquire a camera that has manual exposure controls and shoots in the RAW image file format rather than just JPEG - especially when you are using a digital zone system, and there are reasons you shouldn't trust the small monitor on your camera, nor, when shooting in RAW, the camera's histogram - even its multicoloured histogram. Nor should you trust that it will meter a certain way, or meter well to a certain grey reference card you might have, without some exposure compensation you'll have to dial in - an amount of which you won't know until you've tested your camera. We'll leave those matters for now though.
ALL-IMPORTANT TONAL COMPRESSION AND EXPANSION - MADE VISUAL:


Now, before I hint any further at what makes my zone system particularly useful, and why I'm claiming other digital zone systems are inaccurate; it would help if you could visually understand an important concept first, and that is the effect of "tonal compression", and the opposite effect as well - "tonal expansion". The video helps with this but I'll slightly expand on it here. You might already have a notion of using a zone system as taking a range of tones in an image that fall within one tonal range of exposure and, for whatever reason, placing them in another zone - effectively darkening or brightening those tones either using the camera's exposure, or editing, or both. And you would be right. BUT when it comes to taking the range of tones in one zone and placing them in a different zone in the editing phase likely using Photoshop, it's not just a matter of brightening your range of tones or darkening them all by the same amount of tonal difference per pixel. To get a more realistic image, at least to START with before we might want to enhance things if we do, we have to account for tonal compression and tonal expansion. And it would be nice if we could do this in a more realistic way than other digital zone systems do - whether we are, again, blending multiple exposures, or correcting exposure in an image with the intention of using all or part of it.
One thing we haven't looked at yet is correcting exposure post-capture. So let's say we have an overexposed image of what under normal exposure would have looked like a black and grey object, and we want to CORRECT its exposure. [show]:
Is it enough to just darken the whole image by a single tonal amount? Of course it wouldn't be, if we wanted realistic tones. Otherwise, by adjusting the brightness this way but failing to adjust the exposure, we'd be preserving the tonal expansion between the black and grey objects that looked fine this way in the greater amount of light, but too much expanded if we're darkening the pixels all by the same amount. So of course you're going to want to adjust things differently.
Now, the best way to counter the tonal expansion that the camera committed between the normally black and grey objects is an equal and opposite amount of adjustment to the exposure rather than the brightness, or rather the same amount of tonal COMPRESSION, applied in editing. Or a little less if you like the effect of SOME enhanced tonal separation, and if you overexposed your image INTENTIONALLY to achieve that effect. There are many options here, but before we start to think about altering reality, we should really learn how to RESTORE it first, and for that you will need fine control over the process. It may seem odd, but perhaps the most important thing you'll want to be able to do is to correct intentional overexposure.
THE ADVANTAGES AND PITFALLS OF INTENTIONAL OVEREXPOSURE:
Typically a number of photographers DO intentionally overexpose their imagery, and often do so using their camera controls rather than extra lighting, and it's NOT for the purpose of altered reality enhancement. It's because an increase in image quality can be realized from such a higher exposure over an image captured at normal exposure in the first place, at least in the darker areas where noise or grain might have been most noticeable The increase in image quality is realized after restoring the overexposed image to normal exposure using our all-important tonal compression, as this (good news!) reduces unwanted noise and grain as well as degraded colour that can occur in the darker areas. This is better than the opposite problem of accidentally underexposing an image and needing to pull the exposure up on it in editing - raising the noise/grain and colour degradation with it. Therefore it's better to have to adjust from overexposure instead - at least where the tones are not overly clipping in the highlights area. But that's where you can take another exposure without overly clipping the highlights to blend with the rest - in THIS case possibly underexposing on purpose, and without degradation given that you are doing this with the intention of using only the lighter and therefore less obviously "noisy" tones.
If you DON'T do all this, and try to instead expose as high as you can but without overly clipping the highlights using just one exposure, you are employing a method called "ETTR" or "Expose to the Right" which can certainly work well for one exposure in some situations but not with tremendously high dynamic range scenes. ETTR forces you to avoid clipping the highlights to the point that instead of exposing higher than you normally would, you might find yourself actually exposing LOWER, which can introduce all sorts of problems like those I've already mentioned. To be clear, in correcting the image post-capture, even with the right amount tonal separation applied in this case, you'll raise the image's noise and grain, and colour degradation, and probably introduce a muddy quality too. But where you can lock down a tripod and take multiple exposures - even bracketing them without having to touch the camera between exposures that might otherwise need realignment later - this is the better way to go. This gives you more latitude. You'll likely even be able to reduce some of the noise and grain that is somewhat more noticeable in monotone areas of your image that are not even that dark to begin with - like a blue sky. But for highlights that might otherwise blow out, you could underexpose those to better incorporate them in the blend of multiple exposures. That's a case where the underexposure would introduce tonal compression much of which you'll want to preserve after any exposure correction you deem fit, in order to avoid the highlight blowout and to give your image a more gradual highlight rolloff instead.
BUT WHAT ABOUT EXPOSING SPECULAR HIGHLIGHTS IN EXTRA DYNAMIC RANGE BEYOND WHAT WE CAN DISPLAY (BEYOND ZONE VII)?:
The "WRONG" zone scale I've shown is misleading - seeming to suggest that there plenty of stops of latitude between the mid-grey reference and when such a reference exposes to pure white. In reality, we only have 2.5 stops there, which means zone VII is really pretty much the last and only zone to hold detail before highlights blow out. So this inspires a question - what good are zones beyond VII? It's almost a personal question - what good are they to you?
Technology is bringing us cameras with ever greater dynamic ranges, and those can potentially reach beyond our 100% reflectance displayable limit. When we are are exposing our scene normally, specular (ie. mirror-reflected) highlights that reach or exceed 100% reflectance, even if they are are not coloured, are then "whiter than white" - in the sense that they've already exceeded the brightest value that your camera can display in its monitor and so are displayed as being clipped to white. But that is not to say that they are necessarily clipped in a way that the sensor did not record them - even with colour preserved - as a better digital camera MIGHT have extra dynamic range to capture these zones and maybe even a few more beyond our traditional range. In this case, we might want to make the descriptions of zones VIII and IX clear that these zones really hold nothing EXCEPT specular highlights.
On the other hand, some cameras, or even the default RAW conversion outside of the camera, will compress the tones of the specular highlights into a nice film-like highlight rolloff towards the top brim of Zone VII, which is realistically as much as a resulting image that can be displayed without us having to darken our exposure post-capture to show more of the specular highlights - if even the RAW file captured them. Unless we want to stop our camera from doing this highlight compression and can, then we might not even want to include zone IX on our scale, while we could treat zone VIII as really nothing more than the first occurrence of a highlight - possibly specular - that has clipped badly enough to become white even if it was coloured in the first place. On the other hand, there may be occasions where you do want to extend the zones either to match a camera's greater dynamic range or to be simply placeholders for specular highlights and light sources you might spot meter. Even with this though, and the potential higher image quality of exposing beyond what the camera normally displays gained after post-processing (or really "extreme" highlight recovery), there is still the advantage to be considered of underexposing specular highlights just so you can SEE and preview them better before you take your shot.
[WRONG! REVAMP!]:
All things considered then, it would seem overkill to expose anything beyond zone VII on purpose EXCEPT specular highlights.
Zone VII, as I'll demonstrate further later, seems to be our MOST POWERFUL ZONE!
But even that zone could be overkill to expose absolutely everything on through multiple exposures with later exposure adjustment. It's true that for instance you could overexpose the sky to try to reduce noise in the homogeneous parts of it, but some photographers would probably find that to be overkill and instead use retouching techniques and/or noise reduction software - if even the grain bothered them.
TOWARDS AN EASILY SYNCHRONIZED WORKFLOW:
All that I've discussed this is good in theory, but it can all fall apart unless you can easily deal with adjustments synchronized through your workflow from camera to image editing. That is, you should be able to easily do a number of things that starts with first adjusting your camera's exposure on scene, either for the purpose of equal counter adjustment of some tonal ranges in editing or for a more permanent relocation of them to different zones, and then translating those adjustments of stops or fractional stops that were conveniently recorded by your image files into into the proper adjustments in editing - all with the same zones remaining as your accurate measuring stick within that editing process. Such a stop-accurate HDR zone system seemed to me to be missing before I finally made one.
So let's look an image.
You can find lots of beautiful imagery accomplished in great part thanks to a film or digital zone system or HDR elsewhere, so I'm not going to show you such an image here.
Instead, take a look at what's CRAPPY about THIS image I shot. [Show].
I took it both in the RAW format and, to save time, a JPEG format that I hoped I could use right away. This is the JPEG version. I tried to slightly underexpose the foreground so that I could prevent the background from blowing out too much, with the intention of adjusting my foreground exposure back to normal using a tone mapping curve on the JPEG, but that wasn't enough to preserve my background to what I saw on scene with my eyes. I guess I could use the RAW data for editing instead, but how well do you suppose this will work? Do I need a zone system? And isn't that only useful for landscape or city scape photography? Keep in mind that some photographers are finding clever ways to apply HDR to shots with people in them - albeit not portraiture.
Let's say you are going to use a digital zone system with the image I am showing you or perhaps another one like it, that has a blown out background and slightly underexposed foreground as you can see [sky blown out possibly to white in background - plus somewhat underexposed foreground]?
You could use the system, and the RAW file from which the JPEG was converted, to correct the image into something like this. [Show tone curve corrected image only partly corrected].
It looks better, but do you suppose it could still use some work? I actually didn't need to do this much correction using a zone system. I took the simpler route of using a camera that had internal tone mapping curves that I could adjust to accomplish the same thing more quickly, and using a nice gradual curve that probably can't be much improved through editing with a single exposure and a similar curve, and with a zone system. So here, the internal camera curves help. Yes you're welcome for the free advice. The e-book I'm proposing will explain this further, as well as using a more refined tone curves adjustment outside of the camera on the RAW data. I realize I just began to sound like a bad salesman for a digital zone system. But hold on.
There can be issues with using just ONE exposure, and adjusting it ANY of the ways I've mentioned, which by the way all have similar limitations. As you can see for MY one exposure, the correction only goes so far, and we've actually degraded the foreground image when we lightened the darker tones in it, at risk of giving us a muddy look mind you, and achieved by raising as well the grain resulting from noise in those tones. This image degradation might be somewhat forgivable for video especially when viewed in a less than high definition, but not as a picture captured in RAW for a final print, or even a high resolution JPEG meant to fill most or all of a computer screen; and if our highlights are already clipped, it won't do us any good to push that part further the opposite way either.
So that's an example of where my HDR zone system comes in - with stop-accurate adjustments. Such adjustments in any digital zone system I believe should be just a matter of dealing with the tones, including those that might be intentionally over- or under-exposed and placed within a temporary zone, by adjusting them a number of stops - exactly one per zone - into the desired zone. You should be able to do this by simply by observing the zone centres and divisions as defined by their placement on a greyscale. This would be fine if the majority of those zones in most digital zone systems were truly set up to be one-stop ranges AND have accurate placements on a greyscale. So far as I know, some but not all the other digital zone systems have stop-accurate zones, and NONE of them have accurate placements on a greyscale. Any that might purport, or at least leave an implied impression, to have such accurate placements, so far as I know use an equal tonal increment to define most of the zones. With that, simply NONE of the zones are stop-accurate, and at best only one zone comes close, and I can prove that.
I'm not sure why there is this issue with other digital zone systems, but I suspect it comes from a bad adaptation of a zone system I will NOT dispute, and that is the original Zone System by Fred Archer and Ansel Adams that is based on quite a different beast than digital cameras, and that is film. It's not just me who has seen a problem with this mind you...
I think it's good though that the original Zone System HAS inspired the DIGITAL zone systems that followed it, including mine. And certainly the other digital zone systems have been around for awhile and been used successfully, but I'm taking things to the next level with blending MULTIPLE exposures with TONAL STOP ACCURACY though the workflow - again from camera to editing to final image. I'm guessing that I'm the first person to create a truly stop-accurate digital/HDR zone system simply because I was LOOKING for such a system to use and could not find one. But I'm also guessing that if I had waited too long to introduce this system, someone else would have soon enough figured out much the same thing and have beat me to the punch - patent pending.
So, more importantly than putting together a proof of what's wrong with other digital zone systems - some of which is introduced visually in the video - I've developed more than ONE particular stop-accurate zone scale - based on how YOUR camera is likely to perform.
Doing this has a lot to do with something called reflectance percentages that are essentially values taken from a camera's sensor, which in fact as I explained in the video has a so-called "linear" response to light, and it also has a lot to do with how our eyes, which have a so-called "non-linear" response to light, would see these percentages as translated to tones in a greyscale as too dark … UNLESS that is, these tones were also raised to a non-linear curve of LIGHTER tonal values especially where the mid-tones are. Allow me illustrate this to you, with this graph:

You might be familiar with this kind of graph that's called a tone curve, but it's ok if you aren't. Basically the tone curve allows us to take an image with both colour and black and white tones equivalent to those in our greyscale at the bottom of the graph, and map those tones as we see fit into others - particularly a range of them. That's ANY range, into any DIFFERENT range.
This graph demonstrates our possible greyscale range of linear sensor data as linearly converted to RGB tones on the bottom greyscale, and the blue horizontal line represents a range of such linear tones - quite LITERALLY linearly, on that line. If we use this line to map our tones of the bottom greyscale to the other greyscale on the right, NOTHING is changed. That's ok. We're just starting. You'll see that I have a sampling of tones as points on the blue line. These represent linear tones derived from various half stops of light, or increments if you will that each differ by a half stop from each other. This progression actually starts at the top right of the graph at full bright white at tone RBG tone 255, and then gets progressively more compact especially as we get closer to the black RGB tone 0, which I stopped short of to avoid an even greater clutter in that area.
I mentioned before that we want to literally raise this line into a curve to lighten up the tones, especially the mid-tones, and you can see that my sample points have been vertically raised to points on the green curve, and particularly dramatically around the middle of the range. That's our non-linear curve that we use to do the proper tone-mapping that to create tones that are more friendly to our eyes. 100% reflectance as RGB tone 255 of course has no where to be raised and so is not, and although I omitted it, 0% reflectance as RBG tone 0 is not raised either.
Just to clarify, even though we MIGHT use the final results of the tone mapping to RGB tones in, say, a JPEG image, realistically we would not actually STORE RGB tone equivalents on the camera of the light it captured, nor would we necessarily translate our sensor's photon counts into actual reflectance percentages, but it's easier to work here with those kinds of simplified equivalents of the typically much larger numbers that our camera actually IS storing, and in a way that gives us results equivalent to what we want anyway. So this, then, is the linear-to-non-linear conversion we need, in a nutshell - or the curve for this, really. By the way, I mentioned my points represented half stop increments. So what would the tones at those points look like to us? The points on the green curve tell the tale. Just imagine the tones on the greyscale to the right of them, aligned with them. A slight alteration to our prior graph then gives us the half stop divisions:

…which will become VERY important in just a while.
The tone-raising conversion I've taken you through, by the way, has MUCH to do with a common question. Why is a reference grey card that we might use to calibrate our camera, and that LOOKS to be about 50% grey between a scale of 0% for black and 100% for white, called an 18% grey card instead of 50%? More specifically, it might be called an 18% REFLECTANCE card, and that's more than a clue to the answer. Some such cards are rated at a fractionally smaller reflectance to better match being closer to exactly 2.5 stops from a reference 100% reflectance for white. If you feel keen, try to locate this on the tone map above. But don't worry. We'll soon get into this a little more - deriving our conversion with a little math. But for now, math aside, the table I showed before actually tells the tale, shown again now with some expanded data in it this time:

Sometimes another digital zone system will show the zones with amounts of light as reflectance percentages representing the middles of those zones also being reported, or I should say MISreported, as I show here. At least the PROGRESSION of those percentages I show is fine as HALF STOPS. But they DON'T translate into any singular tonal % difference between either half stops OR, as their positioning here might suggest, full stops; and NONE translate to define any precisely 10% part of the greyscale for a full stop as is typically mistakenly shown, much as I am showing you on the table now as the 10% tonal increments. We'd be closer in accuracy, mind you, if we took the zones, which are indicated in the leftmost column of the table as supposedly one-stop range zones, and redeclared them to be half-stop zones in order to match the correct progression of half-stop reflectance values on the rightmost column, but that would be still no cigar as far as the tonal percentages we're using go and the RGB tones they translate into. We might still fluke some good results using a NON-stop-accurate system with frustration mind you, but that doesn't sound fun.
So, what ARE the correct zone divisions then, or tonal percentages or values or WHATEVER we need, in order to define those divisions? Recall the progressive tonal compression I discussed (and showed in the video). And the half stop zone divisions in the greyscale showing that tonal compression? Well take a look at this graph, with the exact same greyscale:

I know the curves look different than the ones of the prior graphs but believe me they actually hold the same values and demonstrate the same conversion, but I changed the bottom axis to accommodate stops rather than a more linear spread of tones, which does tend to change a few things. But let's look back again at the greyscale divisions at the right, based on RGB values, which by the way could be adjusted to slightly different sRGB values for people who might need those instead, which I list in the upcoming table. Either way, you can see these divisions and the progressive tonal compression in the greyscale, and that should tell you how we want to divide our zones - albeit with adjustment to how your camera might deviate from this, but even with that there is still tonal compression. The rest of the graph hints at how the divisions were derived mathematically - performing that eye-friendly linear-to-non-linear conversion I discussed earlier, and which I plan to explain in a more rudimentary way in my e-book. It also indicates where reference grey cards come in to play. Here is that table of sRGB values - with values that again divide a greyscale through tonal compression, and that could be used to create an sRGB step wedge overlay that could be useful for image assessment and editing - albeit not likely as accurate as one derived from testing more specifically how YOUR camera reacts to exposure:

I've got to admit something. I'd be too embarrassed to tell you how long I've been curious to find a viable translation between stops and a greyscale like I've shown you, and how long it took me to figure this out in lieu of easily finding anything, or for that matter how long it took me to figure out what I call my master table, from which the zone divisions and much of the math comes from. Again I'll leave a deeper explanation of this to my e-book, and proceed here with some other matters. But if you're curious to have a look, here's my master table:

Note the right side of the table for an example of actual camera f-stop settings relating to the various reflectance values. I wanted to understand this relationship, but at the same time please realize that adjusting your f-stop for various zones for the purpose of blending multiple exposures together is NOT a good idea, as it makes your depth of (in-focus) field inconsistent. Shutter speed and even ISO are better choices to go with. You'll notice the aperture area and the reflectance values are the same, both columns shaded in grey. Even such a simple relationship to tie in f-stops took me more than a while to figure out. The REAL goal though was to find out what IDEALLY the tones or brightness or lightness values for each half stop, including a reference white and reference grey, the camera should record ASSUMING its goal is to MIMIC human eyesight, which is so far what I have done and presented. This gives us a starting point or reference from which to proceed with analyzing our camera and establishing useable zone scales.
BUT WILL MY CAMERA REALLY RECORD HALF STOP TONES THIS "IDEAL" WAY, AND IS THAT WAY REALLY "IDEAL"? (- LIKELY NO, and NO):
Without getting too technical, I think there is one important question to be asked - playing devil's advocate to my own work here. You or I might well ask: From camera to image, is what we are referring to as "stops" in terms of camera settings or readings off of the sensor actually translating on a resulting image into something that could be measured as being completely ACCURATE, in terms of tones, as stops? The data I've shown you so far assumes a camera that perfectly counts the photons hitting its sensor and, either through the camera or some RAW processing software, does a perfect conversion of linear data to non-linear tones for us - or as perfect as one can expect within a so-called "L.a.b." (/"Lab"/"CIELAB") colour space which, from what I've heard, is perfect enough. This would seem to be a simple, expected norm of how we might expect a camera to operate, but it is an unrealistic expectation of probably most cameras though. This is partly because often the camera manufacturer will determine that a more "pleasing" image can be obtained by giving the camera a different "character"; and also because often the photon counts, which are NOT completely accurate, are converted to tones most popularly for the so-called sRGB colour space using a slightly less accurate formula than Lab; and also because, even if we instead use the sRGB values I've worked out, those will not likely work as they are usually in a sense coloured by a so-called "s-curve". What's an s-curve? Well do you remember that last graph of curves I showed you?
You might imagine the green of that graph turned into an inverted S shape at its top, or otherwise flipped on the horizontal axis with the same treatment at the top - thus turning the curve into what we would call an s-curve. If nothing else, the s-curve bends the top of what we might call a "characteristic" or "exposure response" curve into a curve shoulder to complete the S shape, which then in that area presents greater tonal compression in the highlights - in much the same way as I've pointed out we find in the darks but using a much smaller part of the overall curve. In this small area that deviates from the usual curve, what we're calling a "stop", as it may be adjusted on the camera regulating how much light is hitting the sensor or even adjusting the ISO, is very much no longer acting as an accurate stop as it may be translated to our image - although typically this is more of a concern for JPEG files than RAW files, and a matter of what kind of RAW conversion outside of the camera we area using in our workflow. At the same time, even though the camera's sensor is linear, there CAN be a slight s-curve applied to the RAW data that can't be prevented or undone, and that is for reasons that have more to do with the hardware and electronics of the camera than any software or firmware.
But this effect, which is partly a tonal compression effect, DOES have the advantage of gentler highlight rolloff much like some film stocks - especially if, by the way, we add extra stops of dynamic range to record specular highlights, but then allow either the camera or our RAW conversion, preferably as a non-mandatory option mind you, to tone compress these specular highlights back down so they don't exceed the maximum 100% tone we can display at least when 49.1% tone is at zone V's centre. Yeah, I know that's quite a lot to chew on. I've also observed what I have to assume is the s-curve introducing at least a little tonal expansion and therefore higher contrast from the simple norm in the mid-tones and even to some extent into our darker tones (albeit without reversing the overall tendency of progressive tonal compression into the darker tones as I've discussed). This can give us an image that is more pleasing where higher contrast helps, while combining with the highlight rolloff and similar tonal compression left for the darker shadows that are also pleasing.
But all this veers away from that simple norm or "ideal" of mimicking the mathematical model we have of how human eyesight works. This then makes our job more difficult to create a one-size-fits-all tone scale - but perhaps not so far that we can't come "close enough" at least for a general rule-of-thumb zone scale that's suitable for most digital cameras! We'd likely have to make a zone scale that is "safe" or "cautious" though to avoid highlight blowout - much like the histogram on a camera that doesn't touch the "hidden" highlights in the RAW file - whereas a more customized zone scale would better measure just how far you can push your camera towards highlights ... made farther than you might think thanks to a modern camera with greater dynamic range and an s-curve that deals with that.
To get a better idea of what the s-curve looks like, the green curve you saw above, then, is thus converted, after the bottom axis is flipped, to a different curve that's coming up next, with a similar explanation to what I just gave you embedded in it. But at this point that text is a bit of a digression, or maybe a "bonus" to you depending on your level of interest. You'll find the same graph along with the other graphs and charts I'm showing you here in my e-book:

[WRONG! REVAMP!]:
ZONE VII or ZONE VI IS KING FOR THE ETTR AND HDR CAMPS!:
Let's get back to doing what I promised - showing and comparing those new zone scales. First let's again recall that WRONG scale from before.
Notice way back in the WRONG scale, the description of the best tonal separation and texture being in zone V where we are using a mid or very near mid grey at its centre. This is a description I've taken from similar descriptions of zone V I've found elsewhere, but I'm not sure if I agree with it when we're dealing with equal tonal ranges here. On the other hand, I doubt that there is LESS tonal separation and texture here than on any other zone. Maybe in terms of human perception and psychology, one could argue there is more texture here - I doubt there is very much more though. What I find MORE interesting, though, is that as you are about to see in MY more stop-accurate zone scale, compared to its zone V, there is a much more obviously INCREASED texture and tonal separation, not to mention an increased tonal RANGE, in the two zones HIGHER than V - with zone VII as KING! That's GREAT news for the ETTR and HDR camps! The increase in image quality to zone VII is also made possible with the extra latitude of the image sensor having the capacity to store twice the linear tonal information for this zone than the prior zone VI, with that progression of halving the storage area continuing with each stop until arriving to the darkest tone. So we have plenty of latitude to correct overexposure in post-processing or place it in whatever zone we like, while we have to be more careful with adjusting underexposure.
HOWEVER, in actual practice with a digital camera, this zone might be a little (or even a lot) TOO close to highlight rolloff and too much within a range of tonal compression of light tones in general for adjusting the tones into say zone VI or zone V without degradation. As you'll see from tests I did of one particular camera, for instance, zone VI was the safer "king". Still good news! We can safely overexpose zone V by a full stop! But for any more than that (even a fractional stop) I would suggest testing your camera and ACR-based exposure adjustment! The tonal compression that likely lies in zone VII might even be countered by the digital sensor allocating more data to record the subtle differences between lighter tones than it does to record the differences between darker tones - allowing a tonal range (ie. number of tones) that makes proper, natural looking tonal expansion possible when adjusting the tones to zones VI or V, and making zone VII king again! This sort of thing might even hold true towards making an even higher zone king, but one must test one's camera to know for sure. Usually one has to be careful, for instance, to avoid an unnatural look from recovering highlights that are highly compressed to the point of a diminished tonal range regardless of how the sensor is storing them.
THE "MORE" CORRECT ZONE SCALES:
My next chart is basically a "SEMI-CORRECTED" version the zone scale for a similar or near 18% reflectance mid-grey at zone V (shown as well in the video, but more properly discussed here). For reasons I've already mentioned, it likely does not show EXACTLY how your camera handles exposure tonally, but it is a more educated GUESS as a one-size-nearly-fits-all zone scale - taking into account eyesight mimicry, but frankly no s-curve applied for highlight rolloff. This way our scale is very "safe" and conservative in avoiding trouble with highlights while some cameras we could likely push further. Our scale is also safe for shadows - assuming few stops from our mid grey reference before the tones are black or nearly so with noise and grain and no detail, when again some cameras might show at least slightly more detail or texture here.
For those seeking absolute accuracy from camera to image editor though, as you should, I caution that this scale, despite being potentially more accurate than other generic scales you would see elsewhere, could still be WAY off for your particular camera. But again it helps to have an "ideal" reference to start with and compare things to. So in that vein, make sure your web browser is set wide across your screen as I present TWO tables side-by-side here - the one I promised, and beside that, an example of a custom zone scale made for a specific camera after testing it, as I first introduced in my video. The tones were measured from multiple exposures at different shutter speeds taken at a base ISO using ACR in a "Camera Neutral profile". You may see how the highlights are extended from the simple norm of the first table into a rolloff in the second table, and, looking at the difference between adjacent half-stop zones in that second table, you might see that there is some slight tonal expansion in some mid tones such as in zone V and in darker zones. For instance, from the middle of zone IV where both scales share nearly the same tone, you might observe how there is some slight tonal expansion from the norm in darker mid tones albeit with less expansion the darker we get. I would say though that the more general scale is not exactly WAY off for the camera I tested:


You might find it interesting to compare these two tables. One thing I found interesting other than how ("reasonably") well they compare is how in the second table, zone VII is no longer as I mentioned earlier "king" for the best tonal separation. Zone VI is - although zone V is close enough that it might as well share the title. This is getting back to the notion that zone V is the best for tonal separation. It seems that the character of the camera makes it so, or nearly so. Where zone VII on the first table seems to either just miss the point where tonal compression occurs in the highlights or dangerously touch highlight rolloff, the same zone on the second table seems even more dangerous for its tonal compression, whereas zone VI seems to miss the tonal compression completely. You couldn't pick any other two half-stop ranges to comprise such a tonally wide full-stop range.
Notice in the left/first more general table that the dynamic range from the middle grey to white is limited to the point that zone VIII is "flat" with practically no more tonal dimension than one tonal step if even that much, and there are no more zones after that. One COULD however optionally extend the zones for a camera we might have that can capture specular highlights beyond our 100% reference white without the automatic s-curve tonal compression - much as I did on the right/second table through zone X. I would encourage that such a task up to US instead of assuming that my first table is written in stone. Some might find adding an a specular zone overkill however as you can underexpose specular highlights to better see them on your camera's display and capture them and, if need be, add them back to a zone that would not exceed what's displayable (through exposure adjustment in editing). But the option still remains to expand the zones at least for temporarily holding specular highlights and darker shadows if this is desired. It's possible for instance that the zone scale for YOU might actually be somewhat of a hybrid between the two scales above.
Now, the more general scale you've just seen, discounting any strong s-curve-based deviation that a camera might have from it, is THEORETICALLY FINE for a camera that meters well, or averages what it sees, to 18% reflectance or nearly so. That is to say, your camera should expose your 18% grey card at your so-called ISO baseline, which is your lowest settable ISO, so that the card accurately translates to a 50% tone or very nearly so. But some cameras at the baseline might underexpose the grey card. Doing so in essence takes more of a risk of underexposing some scenes using auto-exposure, but it might actually better expose other scenes - with less of a risk of overexposing them while better protecting highlights since now we're giving more dynamic range between that a lower reference reflectance and 100% white, and possibly with less noise and grain too. But for using the zone scale above, this inaccuracy of metering an 18% grey card is not going to work, unless that is you can accurately adjust your camera's exposure compensation to add enough extra exposure - likely by some small number of fractional stops. People often debate if, in a situation like this, the camera was intentionally manufactured to meter at a lower reference reflectance than 18% to allow those advantages I mentioned, or if in fact the metering system is still set for 18% but the manufacturer set the camera up with the wrong baseline ISO - with that level of amplification of sensor signal and noise somehow affecting how accurately the camera meters EXCEPT when you add the proper exposure compensation. Either way, the EFFECT is the same.
So if you're camera is giving you that effect, and if you don't want to bother with exposure compensation, you're going to need a different grey card - one that is darker and perhaps less traditional than the 18% card. Some people claim that often a camera will meter better to 12.5% reflectance, amongst other numbers not so far from this, and that you're in business then if you can find a 12.5% grey card or even an equivalent patch you can spot meter to. This is a half stop darker reflectance than 18%, giving us that extra half stop in dynamic range from reference 100% white. So how many stops does that give us between our grey and white references? Let's see. 12.5 doubled is 25, then 50, then 100 (unless you prefer to start with 100 and halve) - so 3 stops, precisely. To get the reflectance values in-between any of these full stop increments, like our ideal 17.68% middle grey, you have to use the square root of two to fit our non-linear progression, but I digress. Let's show my zone scale modified for 12.5% reflectance then, but before you look too deeply at it, the thing I'd ask you to look out for is how, basically, there is VERY little difference between the two scales EXCEPT just a few things. First, there is the half-stop difference in where the zones are placed...

Secondly, there is the extra half-stop of dynamic range between the grey and white references. This sort of forces us to add a zone IX as a "flat" zone if we need such a reference zone - although this is a zone that might be considered flatter than even just one tonal step, without dimension if you will, as by our mathematical model it can only be reached through overexposure or the potential arguable overkill of specular highlights I mentioned - but on the other hand in reality it can be reached by cameras like the one I tested in the graph prior, which believe it or not has only a one-inch chip - a Nikon 1 V2 that does a GREAT job capturing highlights beyond reference white, but tested mind you under INDOOR lighting for my table. I was able to adjust the camera's shutter by third and full stops but not by half stops. However, ACR's Exposure Slider matched the resulting tones so well that I could use it to interpolate any tones I was missing.
So, I've left zone IX in the scale as kind of a non-zone, but also a flag of a zone that you should NOT assume you can use at least in terms of trying to capture this range with your camera accurately metering to 12.5% reflectance - UNLESS that is your camera has tested that it CAN use that zone, in which case you could alter the scale. You'll get a sense of whether it can even just by the highlight recovery that you can accomplish in ACR.
Otherwise, no great differences between the two "general" scales.
Who said it had to be harder than this?
As I mentioned in the video, which zone scale you use depends on which one your camera works best with - that's something the e-book gets into, in terms of testing your camera. And don't forget that, more in line with the chart prior to the last one, there's a THIRD option here to find and establish zone scale divisions in a fashion that is more customized and accurate to your camera - based on somewhat more extensive testing of your camera. There's really no math or graphs involved in that either!
Arriving at a customized zone scale like the prior one shown might prove more useful in the acquisition phase of an image than in editing, and thus this scale might prove more important than any step wedge overlay that might be derived from it. But at least some people with exacting standards will find use in such an overlay, so it's good to have that option. Here is one, for instance, derived from the prior example of a customized zone scale:

This concludes the technical part of my proposal/proof. I may decide to go in depth technically and mathematically even more at some point - perhaps on another web page if not in an appendix of the e-book itself - as this page was whittled down (I know that may be hard to believe) from such a larger report.
Please feel free to check out my Indiegogo campaign or return to it if you've come here from there, by clicking on this link:
[link].